Identification of types, hours when, and places where crimes are committed in the City of Walnut Creek, between 2014 to 2016
By: Marco Roncagliolo
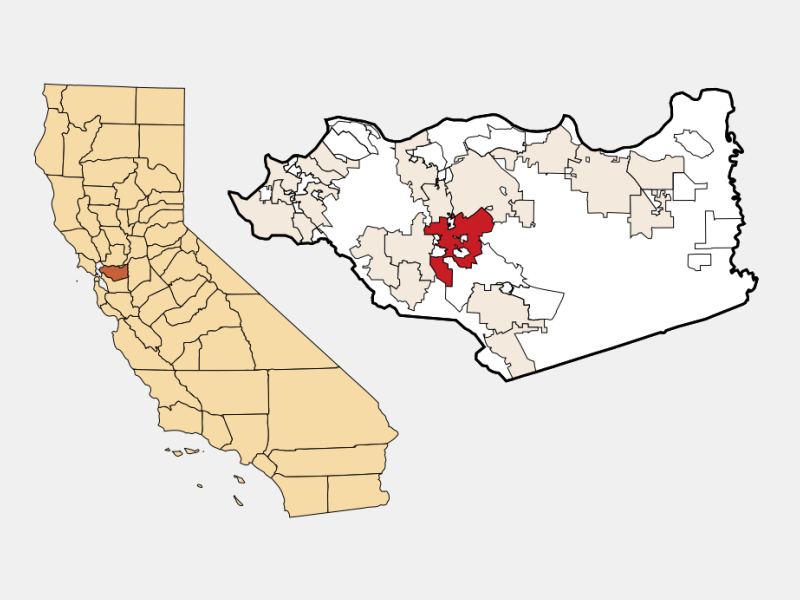
City of Walnut Creek
City of Walnut Creek is a district in the Contra Costa County, in the State of California. Walnut Creek population was 65, 684 in the year 2014.[1] The first to have sighted were the Spanish explorers in 1772, it was the home of the Volvons, a tribe of the Bay Miwok. Later in 1849, William Slusher established in the west bank of Arroyo de Nueces (also called Nuts Creek). Finally, in October 16, 1914, local voters approved the incorporation of the original town and sorrounding area as the eight city in Contra Costa County.[2]
Crime in the City of Walnut Creek
The Walnut Creek Police Deparment publishes a Crime Statistics (WCPDCS) is divided between Persons Crime (Rape, Robbery, and Assault) and Property Crime (Burglary, Burglary - Residential, Burglary - Vehicle, Theft, and Motor Vehicle Theft), but it does not include other types of crimes mentioned in the LexisNexis Community Crime Map. For this reason, first I will show the increase and decrease of crime using the Crime Statistics provided by the Walnut Creek Police Department from the years 2014 to 2015, and the years 2015 and 2016. Later, I will use the information in the Community Crime Map of the past 6 months of the year 2016 to established the least and most committed crime in the City of Walnut Creek. Let us begin with the following chart:

The Walnut Creek Police Deparment Crime Statistics, it measures two main types: Persons Crime (increased 13% from 2014 to 2015) and Property Crime (increased 4% from 2014 to 2015). Subtypes of Persons Crime: Homicide increased 100% (from 0 in 2014 to 1 in 2015); Rape increased 13% (from 301 in 2014 to 340 in 2015); Robbery increased 23% (from 26 in 2014 to 32 in 2015); Assault increased 13% (from 262 in 2014 to 295 in 2015).[3]
For the subtype of Property Crime: Burglary increased 9% (from 985 in 2014 to 1,077 in 2015); Residential Burglary decreased 23% (from 207 in 2014 to 160 in 2015); Vehicle Burglary increased 19% (from 528 in 2014 to 630 in 2015); Theft decreased 1% (from 1,277 in 2014 to 1,258 in 2015); Motor Vehicle Theft increased 12% (from 317 in 2014 to 354 in 2015); Property Theft increased 4% (from 2,579 in 2014 to 2,689 in 2015). [4]
In synthesis, in Persons Crime only Rape is the one to have decreased (1%), while Assault is the most committed crime with an increase of 13%. In the opposite, Property Crime only two have increased, Residential Burglary (13%) and Theft (1%), while Burglary, Vehicle Burglary, and Motor Vehicle Theft are the most commited crimes and the ones to have increased respectably 9%, 19%, and 12%.
The same for the crimes committed in the City of Walnut Creek between the year 2015 to 2016(01/01/16 to 02/29/16) are the following:

The Walnut Creek Police Deparment Crime Statistics, it measures two main types: Persons Crime (increased 13% from 2014 to 2015) and Property Crime (increased 4% from 2014 to 2015). Subtypes of Persons Crime: Homicide increased 100% (from 0 in 2014 to 1 in 2015); Rape increased 13% (from 301 in 2014 to 340 in 2015); Robbery increased 23% (from 26 in 2014 to 32 in 2015); Assault increased 13% (from 262 in 2014 to 295 in 2015).[5]
For the subtype of Property Crime: Burglary increased 9% (from 985 in 2014 to 1,077 in 2015); Residential Burglary decreased 23% (from 207 in 2014 to 160 in 2015); Vehicle Burglary increased 19% (from 528 in 2014 to 630 in 2015); Theft decreased 1% (from 1,277 in 2014 to 1,258 in 2015); Motor Vehicle Theft increased 12% (from 317 in 2014 to 354 in 2015); Property Theft increased 4% (from 2,579 in 2014 to 2,689 in 2015).[6]
In synthesis, in Persons Crime only Rape is the one to have decreased (1%), while Assault is the most committed crime and with an increase of 13%. In the opposite, Property Crime only two have increased, Residential Burglary (13%) and Theft (1%), while Burglary, Vehicle Burglary, and Motor Vehicle Theft are the most commited crimes and the ones to have increased respectably 9%, 19%, and 12%.
Another source is LexisNexis Community Crime Map (LNCCM) connects law enforcement with the community to reduce crime and improve public safety. It goes beyond crime mapping by automatically alerting the public about recent crime activity and by improving communication between the public and law enforcement. And empower the public to make better decisions about crime by putting the same technology used by law enforcement to analyze and interpret crime activity.[7]
The Metadata of the Walnut Creek Police Department from July 1, 2016 to September 20, 2016 provides the type of crime, area, estimated addresses, hours of the day of the week, and days of the month with the highest frequency committed in the City of Walnut Creek. The following Chart takes the information of all the crime committed including minor crimes[8]:

The Crime Class includes: Traffic Accident represent 28% of all crime (140); All Other Non - Crime represent 16.6% of all crime (83); All Other Criminal represent 10.6% of all crime (53); Motor Vehicle Theft represent 8.0% of all crime (40); Burglary of Motor Vehicle represent 7.6% of all crime (38); Fraud represent 7.6% of all crime (38); Alcohol Violation represent 4.2% of all crime (21); Assault - Other represent 4.2% of all crime (21); Burglary - Commercial represent 3.6% of all crime (18); DUI represent 2.8% (14); Drug/Narcotics Violation represent 2.0% of all crime (10); Vandalism represent 1.8% of all crime (9); Theft represent 1.0% of all crime (5); Burglary - Residential represent 0.8% of all crime (4); Disorderly Conduct represent 0.4% of all crime (2); Robbery - Individual represent 0.4% of all crime (2); and Sexual Offense - Other represent 0.2% of all crime (1).[9]
In synthesis, the most crimes committed include Traffic Accident (140), All other No - Criminal (83), All Other Criminal (53), Motor Vehicle Theft (40), Burglary of Motor Vehicle (38), and Fraud (38). While for the less committed crimes, Disorderly Conduct (2), Robbery - Individual (2), and Sexual Offense (1) in the past 6 months of the year 2016. In summary, Traffic Accident is the most committed crime, and Sexual Offense the least committed crime given by the LexisNexis Community Crime Map.
In conclusion, the Walnut Creek Police Department Crime Statistics shows that the Persons Crime had Homicide (0 in 2014 and 1 in 2015) as the least committed crime, while the Property Crime had Theft (1,277 in 2014 to 1,258 in 2015) as the most committed crime. The same Crime Statistics shows that in Persons Crime for 2015 to the first two months of 2016 Homicide (0 in 2015 to 0 the first two months of 2016) as the least committed crime, while in Property Crime had Burglary (223 in 2015 to 177 the first two months of 2016) as the most committed crime. In comparison, the LexisNexis Community Crime Map shows Traffic Accident (140 in the past 6 month of 2016) as the most committed crime, while Sexual Offense (1 in the past 6 months of 2016) as the least committed crime in the City of Walnut Creek.
Hours of the Day of the Week

The Analytics of the LexisNexis Community Crime Map organize the days of the week by hour that a crime is committed. A colour will represent the ammount of committed crimes: Orange, represent the hours which more number committed crimes happen; the yellow colour, represents the day of the week by hour less number of crimes happen; and finally, the green colours, represents the day of the week by hour committed crimes almost does not happen.[10]
This anylisis will describe first the orange day of the week by hour crime happens: Wednesday, Thurday, and Friday from 10 A.M. until Noon; Tueday and Wednesday from 3 P.M. to 4 P.M.; Wednesday from 6 P.M. to 7 P.M.; Thursday, Friday, Saturday, and Sunday from 9 P.M. to 10 P.M.; and Sunday from 4 P.M. to 6 P.M.. The hours by the day of the week were there is more criminal activity or committed crimes Wednesday from 10 A.M. until Noon, Thursday, and Friday; Wednesday from 3 P.M. to 4 P.M.; and Thursday, Friday, Saturday, and Sunday from 9 P.M. to 10 P.M.[11]
The second is yellow colours which represents less committed crimes: Monday from 6 P.M. to 8 P.M. there are less criminal activity in the City of Walnut Creek. And the third is the green colour which represent almost no committed crimes: Monday from 6 A.M. to 4 P.M.; Tuesday from 6 A.M. to 11 P.M.; Wednesday from 12 A.M. to 1 A.M., and from 10 A.M. to 11 P.M.; Thursday from 12 A.M. to 1 A.M., from 7 A.M. to 1 P.M., and from 3 P.M. to 11 P.M.; Friday from 12 A.M. to 1 A.M., and from 5 A.M. to 11 P.M.; Saturday from 12 A.M. to 3 A.M., from 6 A.M. to 1 P.M., from 3 P.M. to 5 P.M., and from 6 P.M. to 11 P.M.; and Sunday from 12 A.M. to 4 A.M., and from 7 A.M. to 9 A.M., and from 10 A.M. to 11 P.M.[12]
In conclusion, the red colours or the hours which more crime is committed happens: Wednesday at Noon, from 3 P.M. to 4 P.M., and from 6 P.M. to 7 P.M.; yellow colour which represent less committed crimes only: Monday, from 5 P.M. to 8 P.M.; and the green colour which represent almost no committed crime: Monday from 7 A.M. to 11 P.M., and Saturday and Sunday from 12 A.M. to 3 A.M., and 7 A.M. to 11 P.M.. In other words, Wednesday is the day by hour Noon, 3 P.M., and 6 P.M. most committed crime happen, while Monday is the day by hour 6 A.M. to 11 P.M. least committed crimes happen in the City of Walnut Creek.
Areas with most Criminal Activity

In this analysis, the importance to identify areas with most committed crimes or less committed crimes, for that is necesary to separated into four areas: Northern Walnut Creek, closer to the City of Pleasant Hill and the City of Laffayette; Center Walnut Creek, downtown; Western Walnut Creek, is the area of Rossmoor and next to the City of Laffayette; South Walnut Creek, include Wild Oak, Joaquin Ranch, Rudgear Estates, and Sterlings; and East Walnut Creek, is the area sorrounding Mount Diablo Foothills Park, and Lime Ridge Open Space Park.[13]
In Northern Walnut Creek, the green (BMV and MVT), red (F and AO), and gray colours (TI, AOC, and AONC) identify a type of crime. In the Main Street area, there is gray, green, and red colour dots that identify crimes mainly Burglary of Motor Vehicle, Motor Vehicle Theft, Fraud, Assault-Other, Traffic Incident, Aggravated Assault, and Assault-Other. So the gray colour dots is the most most crimes committed, which are: Traffic Incident, Aggravated Other Crime, and Assault Other- Non Criminal.[14]
In Central Walnut Creek, which include Downtown Walnut Creek in the following: Main Street, South California Boulevard, and South Broadway. There is an increase of red (F and AO), and gray (TI, AOC, and AONC) colours dots. The crimes are committed is the Gray and Red colour, which are: Fraud, Assault-Other, Traffic Incident, Aggravated Assault, and Assault-Other.[15]
In the Western Walnut Creek, which is Roosmoor and between Ptarmigan Drive and Stanley Dollar Drive, appear only red colour dots. The red colour dots represent Fraud and Assault-Other. These types of crimes mentioned are considered the most committed crimes in the Western Walnut Creek.[16]
In Eastern Walnut Crek, which is Ygnacio Valley Road closer to one side Bancroft, and the other closer to Mount Diablo Park. There is an increase of red (F and AO), and gray (TI, AOC, and AONC) colours dots. The most commited crime is red colour dot, which are: Fraud and Assault-Other.[17]
And in South Walnut Creek, which is closer to Mount Diablo Park, Shelf Ridge Open Space, and Sugarloaf Open Space. There is gray, green, and red colour dots that identify crimes mainly Burglary of Motor Vehicle, Motor Vehicle Theft, Fraud, Assault-Other, Traffic Incident, Aggravated Assault, and Assault-Other. So in the Southern Walnut Creek, the red colour dots is the most most crimes committed, which are: Fraud and Assault-Other.[18]
In conclusion, in Northern Walnut Creek, the most are the gray colour dots, which are the most most crimes committed, which consists of: Traffic Incident, Aggravated Other Crime, and Assault Other- Non Criminal. In Center, the most committed is represented by the gray and red colour dots, which are: Fraud, Assault-Other, Traffic Incident, Aggravated Assault, and Assault-Other. In the West, the most committed crimes are represented by the red colour dots, which are: Fraud and Assault-Other. In the East, the red colour dots is the most committed crimes, which are: Fraud and Assault-Other. And in the South, the most committed crimes are represented by the red colour dots, which are, which are: Fraud and Assault-Other.
In general, Central Walnut Creek is the area where most of the crimes are committed, while West Walnut Creek is the area where the least crimes are committed. In all of the City of Walnut Creek, the red and gray colour dots are the most, which represent: Fraud, Assault-Other, Traffic Incident, Aggravated Assault, and Assault-Other. But the least committed crime is a red colour dot, which represent: Fraud and Assault-Other.
General Conclusions:
The Spanish explorers in 1772, first sighted the home of the Volvons, a tribe of the Bay Miwok. In October 16, 1914, the local voters approved the incorporation as the eight city of Contra Costa County.
The Walnut Creek Police Deparment Crime Statistics, between the year 2014 to 2015, the least committed crime was a Person Crime, Homicide (from 0 in 2014 to 1 in 2015), and the most committed crime was a Property Crime, Theft (from 1,277 in 2014 to 1,258 in 2015).
Between 2015 to the first two months of 2016, a Persons Crime, Homicide (from 0 in 2015 to 0 the first two months of 2016) as the least committed crime, while a Property Crime, Burglary (223 in 2015 to 177 the first two months of 2016) as the most committed crime.
The Lexis Nexis Community Crime Map, between July 1 to September 20, of 2016, shows Traffic Accident (140 in the past 6 month of 2016) as the most committed crime, while Sexual Offense (1 in the past 6 months of 2016) as the least committed crime in the City of Walnut Creek.
Wednesday is the day by hour: Noon, from 3 P.M., and 6 P.M., when most committed crime happen, while Monday is the day by hour from 6 A.M. to 11 P.M., when least committed crimes happen in the City of Walnut Creek.
Central Walnut Creek, Downtown Walnut Creek, is where most crimes are committed, while West Walnut Creek, in Roosmoor, is where the least crimes are committed. The Red and Gray colour dots are the most committed crimes in all of the City, which are: Fraud, Assault-Other, Traffic Incident, Aggravated Assault, and Assault-Other, while the red colour dot, where the least crimes are committed, which represent: Fraud and Assault-Other.
Sources:
-Walnut Creek Police Deparment: Crime Statistics from 2014 to 2016.
-Lexis Nexis: Community Crime Map from July 1 to November 20, 2016.
[1] City of Walnut Creek (2014) "Demographic Information". About us. http://www.walnut-creek.org/about-us/community-profile/demographic-information.
[2] Walnut Creek Historical Society. "Walnut Creek's History: A look back". History. http://walnutcreekhistory.info/wchs/history/local-history/ (Consulted: 7 of August of 2017).
[3] Walnut Creek Police Department Crime Statistics. "2015 Year-End Crime Statistics". http://www.walnut-creek.org/departments/public-safety/police/crime-mapping/crime-statistics (Consulted: August 7, 2017)
[4] Loc. Cit. http://www.walnut-creek.org/departments/public-safety/police/crime-mapping/crime-statistics (Consulted: August 7, 2017)
[5] Walnut Creek Police Deparment. "2016 Year-To-Date Statistics". Crime Statistics. http://www.walnut-creek.org/departments/public-safety/police/crime-mapping/crime-statistics (Consulted: August 7, 2017)
[6] Loc. Cit. http://www.walnut-creek.org/departments/public-safety/police/crime-mapping/crime-statistics (Consulted: August 7, 2017)
[7] Lexis Nexis (2016) "Community Crime Map". http://communitycrimemap.com/overview/about.html (Consulted: August 7, 2017).
[8] Lexis Nexis (2016) "Community Crime Map". http://communitycrimemap.com (Consulted: August 7, 2017).
[9] Loc. Cit. http://communitycrimemap.com (Consulted: August 7, 2017).
[10] Loc. Cit. http://communitycrimemap.com (Consulted: August 7, 2017).
[11] Loc. Cit. http://communitycrimemap.com (Consulted: August 7, 2017).
[12] Loc. Cit. http://communitycrimemap.com (Consulted: August 7, 2017).
[13] Loc. Cit. http://communitycrimemap.com (Consulted: August 7, 2017).
[14] Loc. Cit. http://communitycrimemap.com (Consulted: August 7, 2017).
[15] Loc. Cit. http://communitycrimemap.com (Consulted: August 7, 2017).
[16] Loc. Cit. http://communitycrimemap.com (Consulted: August 7, 2017).
[17] Loc. Cit. http://communitycrimemap.com (Consulted: August 7, 2017).
[18] Loc. Cit. http://communitycrimemap.com (Consulted: August 7, 2017).


Comentarios
Publicar un comentario